

The Status of Risk
MA crossover

I got this indicator from the metatrader yahoo group. Here is an indicator for you who use MA crossover. The indicator shows red color if the slow MA cross down fast MA and blue color if it is otherwise. The color setting can be change as well as the width. Default setting is MA 12 and MA 26. Okay, feel free to download below.
Download Indicator Metatrader
Debt Consolidation
 Let's assume you want to open a small business, home renovations, vehicle down payment, or even to buy a computer as your child's request. But you do not have the money. In fact, the above-mentioned purposes can not seem to be delayed again. If waiting for you to collect the money bit by bit, maybe just this purpose will be bought one two years away. Well, it seems there is no other way. You need to debt consolidation.
Maybe you even begin to consider to finding debt consolidation companies. Then you come to the bank and met with officers (officers who work taking care of the bank credit products known as the accounts officer). The officer said that if you want to get a loan from the bank, you must complete the requirements. One of the conditions is to guarantee that you own property such as houses and cars. Thus, if you happen not to repay the loans, you can submit a house or a car instead of your credit is bad.
You then think, well I already have a house and car. Not bad, so you thought. Okay. You then fill out the application form credit card debt provided to you. You start filling your name, address, occupation, including the value of a house or car you have.
Volatility Illuminated

Book Synopsis
Why is Volatility Illuminated so powerful?
Volatility Illuminated presents durable up-to-the-minute strategies for intraday and swing traders (institutional and retail) including: WVAV - Whistler Volume Adjusted Volatility (assisting VWAP trading), WAVE-PM - Whistler Active Volatility Energy Price Mass, Fibonacci Pitchforks, and Quad CCI. In addition, readers will learn the importance of subset distribution compression, expansion, acceleration, force and mass, all pulled together in a simple, easy-to-understand format. Volatility Illuminated elucidates critical underpinnings of market volatility and price action, which many never discover. Volatility Illuminated is timely, empowering, applicable, and can help traders understand erratic movements within markets…once and for all.
Do you want to know the truth about the financial markets? Mark Whistler tells you the truth, at least his own truth. Volatility Illuminated is a long and dense book (roughly 500 pages) where Mark explains his personal view about the financial markets introducing a new paradigm. So this is not a book to be read in a weekend but to be carefully studied and digested, as there’s a lot of information inside to think about.
Therefore this is not the kind of book for the anxious trader who wants to learn how to make money quickly trading currencies and other instruments, but rather for the trader who wants to learn more about the current paradigm governing the markets and get insight in the main reasons of volatility.
Of course, this is not only a theoretical book, as it includes a lot of strategies based on the paradigm presented by the author. Those traders who love “geometrical” trading methods will find very interesting the combination of Fibonacci retracements and Andrew’s Pitchfork explained in chapters four and five. Traders looking for new strategies based on oscillators may find Quad CCI strategy appealing in chapter six. And for all those quantitative traders out there, the last chapters of the book are riddled with a lot of new ideas to test, most of them relating physics concepts (mass, acceleration, energy) to financial markets. You won’t probably find another trading book explaining what VWAP is and how to use it in your own trading.
In conclusion, this is a great book, full of very innovative trading ideas and theories, which will probably open your mind to new views of how financial markets work. Whistler’s writing style is catchy and holds interest, while explanations are very clear and enjoyable. The only flaw I could find is that most of Whistler’s ideas are disseminated along the book, so you may think there’s no common thread until you reach the last chapters and tie it all together. Also I would like to find more real examples to gain a deeper understanding, but it looks like the author intends to sow the seeds that will grow in every trader that reads this book.
PPI Shows Inflation is Still Easing, While U.S. Housing Data Disappoint Markets!
Inflation in the United States continues to show mixed signals, whereas the producer price index signaled inflationary pressures eased in September, as the ongoing weakness in demand levels amid rising unemployment and tightened credit conditions continue to weigh down on prices, meanwhile the housing market is still showing signs of stabilization, as we are yet to see a strong rebound in the housing market activity.
The producer price index declined in September by 0.6% following the prior reported 1.7% rise back in August and well below median estimates for a flat estimate, while compared with a year earlier PPI declined by 4.8% more than the prior and expected estimate of -4.3%, meanwhile, core PPI declined by 0.1% also below median estimates and the prior estimates of 0.1% and 0.2% respectively, while compared with a year earlier core PPI rose by 1.8% down from the prior rise of 2.3% and below median estimates of 2.0%.
prices dropped over a variety of items, whereas gasoline prices dropped by 5.4% in September following the prior huge rise of 23.0% back in August, and consumer goods dropped by 0.7%, which further signals that the ongoing weak demand levels will probably continue to weigh down on the general level of prices and this rather supports the Feds’ projections that core inflation will remain subdued.
However, the outlook of inflation remains a major worry for the Federal Reserve Bank at the moment, as though inflation is still under control over the short term, yet over the long term, the outlook for inflation is a threat, as it’s widely expected that inflation rates will start to soar once the economy regains its health due to the huge increase in money supply as a result of the Feds’ programs.
The U.S. economy started to show signs of recovery during the third quarter of this year, and it’s widely expected now that the U.S. economy started to expand during the third quarter, as activity in the manufacturing, services, and housing sectors seem to be either stabilizing or even rising, however, this doesn’t mean that we are out of the woods yet, as challenges remain.
The housing market in specific has been showing signs that the worst slump for the sector since the Great Depression is coming to and end, as the housing market seems to have hit the bottom, whereas cheap home values in addition to the government’s aid for first time home buyers managed to help the sector and helped in stabilizing activity, yet the housing sector still has a long way to go.
Housings starts rose less than expected in September according to a report released today, whereas housing starts rose by 3,000 to 590,000 units from the prior revised estimate of 587,000 and well below estimates of 610,000, while building permits declined in September to 573,000 from the prior revised estimate of 580,000 and below expectations of 590,000.
The housing market will probably continue to show signs of stabilization over the upcoming period, as we don’t expect activity to start rising over a noticeable pace yet, especially, as rising unemployment and tightened credit conditions continue to weigh down on overall activity including activity in the housing market.
Article source : http://www.fxstreet.com
Three ways to manage risk
This article is taken from the Trader's Journal magazine (April 2009 issue)
The author, Sam Seiden, brings over 15 years experience of equities, Forex, options, and futures trading that began when he was on the floor of the Chicago Mercantile Exchange. He has traded equities, futures, interest rate markets, Forex, options, and commodities for his personal interests for years and has educated hundreds of traders and investors through seminars and daily advisory services both domestically and internationally. Sam has been involved in the markets since 1991 both on and off the floor of the Chicago Mercantile Exchange. He has served as the Director of Technical Research for two trading firms and regularly contributes articles to industry publications. Sam is known for his trading, technical research, and educational guidance.
- One certainty in trading is that losses will occur. Sam Seiden looks at effective ways to manage the risk in trading to enjoy a long and successful career.
Source article: http://www.fxstreet.com
Two Most Important Questions You Must Answer Before You Trade Forex
As a young graduate who was earning a good starting income many, many years back,I was attracted to trading stocks and shares as a traditional way of investing my hard earned money to try to create personal wealth. Since then, I often meet people who would tell me that right now, opportunities to make money from investing in the stocks and futures market, the forex and commodities markets are much lesser. To them, the golden years of investing are all but over.
But is this really so?
I have gone a long way since my beginning years as a novice trader and investor. Experience has taught me that the markets do not move in a straight line. The market by itself is what is termed " a sum of its parts'. For example, in the stock market, there are stocks that move in cycles that repeatedly manifest their movements in easily trackable cycles, and waves that we term "Elliot waves". Thus, we find a lot of traders utilizing a well known method of trading in the footsteps of the legendary trader WD Gann, who had an uncanny ability to discover the cycles of the market and to forecast the "squaring of time and price".
Experience has also taught me that there are stocks that are non-cyclical as well. So at any one time, there are many stocks and shares that are moving up or trending up, and there are stocks that are in various phases of trending down. Some stocks are cycling up, while others are cycling down and some just are trading within a tight range. With these various movements, there are open opportunities for a trader or investor to put his money into stocks and shares, commodities and forex at any time - because each trading vehicle displays its own price movements in its own particular way. This means, you can invest and trade the markets at any time, in season or out of season!
The second most common question that I encounter as a trader is this :" Just what would be a good way to trade the markets?"
Instead of jumping straight into methods of trading, what is important even before you ever start to learn to trade, is a personal evaluation of your own risk profile. You have to discover your tolerance for risk, which boils down to the amount of capital you are going to employ in your trades, and how much pain you are able to tolerate in the event the trade goes against you and you are in a drawdown, and when you will want to quit the trade in the light of the loss. If you are a conservative trader, then day trading is NOT for you and you may wish to look at long term position trading.
If you are an aggressive trader and like action, day trading and perhaps swing trading may be suitable. It is easy to be blinded by sheer greed at this time, because you can set yourself an unrealistic objective of making a million dollars in trading income when your capital is merely $10,000 and you do not have leverage such as a margin account.Such an objective will likely see you losing all your money because you will need to assume the highest risk....which will be unreasonable risk, and will ensure the rapid depletion of your capital.
Once you have sorted out your own risk profile and understand your self- your ability to take risk against the expectation of profits and gains, then you are poised to take the next step which is to discover the best trading method that is suited to your personal trading profile.
Need more information about trading forex to provide a consistent income? Discover for free how a professional trader creates his 5 figure income by trading forex using 3 powerful proven trading Price-Action trading strategies involving No-Indicators, and how you can personalize these same systems for your own use today. Visit http://1forex-trading.blogspot.com
by Peter Lim
Support and Resistance

Metatrader Indicator
Just want to make sure everyone seen this indicator. It's called "Support & Resistance (barry)" and I really don't know why what 'barry' means..hmm..maybe he is the owner..hmm..
Anyway, can you guess what this indicator can do? It is an indicator that shows.. support anndd.. that's right! it shows resistance too. Now, you might think that I'll give you only one file. Nooo...Instead of one Support & Resistance (Barry) indicator, you can have two. Yes! Two!
Fibo MA Indicator

Source: http://forex-junkie.blogspot.com
DOWNLOAD FIBO MA Upper
DOWNLOAD FIBO MA Middle
DOWNLOAD FIBO MA Lower
Good, Bad and Ugly Chart
In the XLT room, we also accept that there is a plethora of fundamental information and economic news being released each and every day but we don't fall into the trap of basing our trading decisions upon this data. And there is a reason why. Think back to when you first considered trading the Forex markets: Remember how you learned of the leverage you could trade with and the flexibility of a 24-hour market? Do you also remember how you discovered that the Forex market was more transparent than the stock market because there was no such thing as insider trading? Everyone receives the same economic data at the same time, therefore, allowing a much fairer opportunity to trade the news and Fundamentals...or so it seemed. If your experiences of trading are anything like mine (and let's face it, we all go through pretty much the same things at the start of our trading careers), then you soon learned that the market has a habit of doing exactly what the news and Fundamentals suggested it would do one day, only to completely ignore this information on another day and do the complete opposite! Very frustrating indeed, so to be consistent there is a need to ignore the outcomes which could happen and focus on what is actually happening.
After a number of years working to develop my own style of trading, I have taken the route of focusing on the technicals to make my decisions and allowing price action to guide me in the markets and the reason why comes down to a very simple logic. Price itself is the only honest thing I can rely on. The market functions as a discount mechanism where the big money factors the fundamental information and expected news into the current price, ahead of time. The current price is a result of all of the information from the past, from now, and what is expected in the future. All I need to know is where price is in the instant and if it is cheap, then I am an interested buyer; if it is expensive, then I am an interested seller. Even if the Fundamentals line up with the market's price action, I still can't gauge an entry or an exit from this information alone. I need something more and this is where the use of charts and objective Technical Analysis comes into its own. We can never get the news and Fundamentals to line up perfectly with the market's reaction everytime, so the solution is to sit back, stick to the plan and take the guess work out of it. Let's look at some recent examples of market action and Fundamentals.
The Good
Here is an example of some recent price action on AUDUSD
This currency pair has been in a big uptrend for a while now, supported by Australia's stable economic position and also by the rising price of Gold. The nation also made a surprise interest rate hike on Tuesday, October 6th, which further supported this uptrend. So here we have an example of where the Fundamentals supported the market's price action. However, it is also important to note that the origin of the latest rally in the currency pair started when it tested a key area of demand on Friday, October 2nd. This was before the rate hike, at an area where a number of XLT students took this pair long in advance, well before the news and without any knowledge of the upcoming rate increase.
The Bad
Now let's take a look at EURUSD. From September 22nd the pair sold off sharply, supported by various bad economic data from the region including low CPI figures, low consumer confidence and low employment stats. Even a German election didn't help until the market hit an area of demand and erased its losses around the same period of time. A tough one to call for sure; so much easier to just go with the trend until you have a reason to change tactics, like when we hit an area where the pair is cheap and the probability is that it will rise. Or in other words, a point at which demand is objectively greater than supply. No amount of news of Fundamental analysis could have predicted a turn as sharp as this. The best plan is to just trust the price.

The Ugly
And then we have my domestic currency the Pound. I can't really bracket this as anything but a mess right now. We all know that the UK is well over-leveraged, very much in debt and recent figures have shown further declines in the current account, Manufacturing PMI and our economists remain as gloomy as ever. It seems that housing prices have risen a little but nobody is getting too excited about that either and the GBPUSD price action is a true reflection of this. It is ugly to say the least: Stuck in a range between support and resistance with mixed signals and little follow through. Trust me, at the time of writing this article, there are much better things to trade.

All we can do as GBPUSD traders is to wait patiently, set realistic targets and focus on the price action...for now the market is just sitting on its hands and most of the time it pays as an independent trader to do exactly the same when things are this ugly!
In summary, the point I am making is that we can never fully interpret the Fundamentals and news and how these factors will affect price. Of course, every piece of news released should have a predefined impact upon the market depending on its nature, but so often the result is the complete opposite and why should we be surprised? How can any trader in the world today objectively interpret Fundamentals and news if they don't know exactly what every other trader or institution is doing at the same time? This is an impossible task. Rather, it would be far easier to allow the market itself to show you subtle clues as to where it is likely to turn; gather your evidence, take the trade, place your stop and let things be. In reality, the only honest thing in any market is the price, so trade that and that alone. Everything else is pretty much opinion and if the market does not share the same opinion as yours, then you could be in a world of hurt. Something to think about for the future I hope.
Article source: http://fxstreet.com
4 Steps To Swing Trading Success
Swing trading in forex is simple to do and it’s a great way for novice traders to start trading - it’s also fun and a great way to pile up big profits. Let’s look at swing trading in forex and 4 simple steps to help you succeed.
Here are the 4 steps you need to make swing trading a profitable part of your overall forex trading strategy.
1. Valid Support and Resistance
You need to spot it and use it to spot trades.
Generally look for at least 3 tests of support or resistance.
Tests that take place in time frames that are wide apart, tend to be more valid and while 3 is a minimum of tests, the more tests there are the better.
Once you have spotted tests of support and resistance, then its time to execute your trading signal.
2. Confirm
The key with any form of trading and swing trading in forex is no different, is not to simply trade into support and resistance - this wont work.
Why?
Because - you are simply hoping or guessing the levels will hold.
Hoping and guessing, are not a good way to seek profits in any venture and swing trading in forex is no different.
You need to confirm that the levels are going to hold and this means using momentum oscillators.
These can be used to measure shifts in momentum of price.
For example, if prices move towards resistance and turn away with price momentum on your side, you have the opportunity to execute your trading signal in line with this shift and have the odds on your side.
You’re not predicting or hoping – you are seeing the reality of price change on your forex charts and acting on the reality.
Confirming a turn is an essential part of swing trading success.
So what indicators should you use for indicating momentum shifts?
A Great couple of indicators to start with are:
The stochastic and the Relative Strength Index (RSI) There not the only ones but a great place to start – so look them up.
3. Stop and Target
Your stop should be behind the level of support or resistance and you should have a profit target.
When you are swing trading in forex you are seeking smaller FX profits and they can disappear quickly, so have a target to take profits earlier than most people i.e before the text of the next level.
When you hit your target bank it.
The closer the trade comes to the next level, the more the odds of recoil against you are - so bank early.
4. Shop Rates
If you are long term forex trend following the cost of business is low as you are trading infrequently and have bigger profits per trade.
With swing trading in forex, you are trading more often and pips mount up, so shop around and look for 2 pips on the majors.
Another important point to keep in mind when swing trading is:
You want liquid markets so stock with the major currencies such euro, yen and pound, although you can trade the Australian and Canadian dollar as well.
The Best Form Of Trading For Novices
Swing trading is great for novices, as it requires less patience and discipline than long term trend following.
Profits and losses come quickly and you don’t need the patience to sit on trends for weeks or months on end.
Swing trading in forex can be done using just basic support, resistance a few momentum indicators.
This simple method can lead you to currency trading success.
While the above sounds a simple system, keep in mind simple methods work best and are far more effective than complicated forex trading systems, as they are more robust and have less elements to break.
Forex Swing trading is easy and quick to learn, is fun and exciting and best of all can make you big forex profits. So if you are trading forex, consider swing trading and you maybe glad you did.
Article Source: http://EzineArticles.com/?expert=Kelly_Price
http://EzineArticles.com/?Swing-Trading-In-Forex---4-Steps-To-Swing-Trading-Success&id=771958
Crossover Signal Using MA
MA crossover signal indicator.
It seems that the signal appears at some point that can be use as stop loss level. The signal is 13 EMA and 21 EMA crossover and I haven't try with other MA period and I use 1 hour chart. This is what I saw:

You can see on the right side that the EMAs crossed again when the SL level got hit. Here is another.

Source : http://forex-junkie.blogspot.com
Bar Close Alarm & Fibo Price Indicator
Here are two indicators that I put on any templates I use. First is Bar Closed Alarm which give sound alarm 2 minutes (adjustable) before a bar/candle closed. It is very useful for any breakout system since most traders will wait for the closed candle and see where it open.

 Second is Set Fibo Price indicator. I like to use Fibonacci retracement as support and resistance level but it only shows the percentage. Adding the Set Fibo Price indicator to your chart and the Fibonacci retracement indicator will show the price anytime! Do I sound like I'm selling something? ;P Anyway the credit goes to the person who made those indicators as I can't remember where I got them. You can download it below.
Download Metatrader Indicator
HIGH - LOW MT1 GBP/JPY

The pair closed at 142.21 last week after. The pair failed to take out 143 resistance and the H4 channel remained intact. The trend in H1 chart is still bullish derived from 30/50 EMA and QQE above 50. However, GBP/JPY did make a LL and LH, which may be an early signal of a downtrend continuation. Immediate support can be seen at 141.6 area while resistance is at 142.9 area. Take a look at the screenshot for trendlines and breakout target. Ok thats all. It's FOOTBALL TIME! ;) Hace a nice trading
Fibonacci Numbers
How to Use Them for Huge Trading Profits!
By Stephen Todd
The Fibonacci numbers sequence and the golden ratio have fascinated mathematicians for hundreds of years.
While Fibonacci numbers have many applications, they have received considerable interest from traders due to their uncanny accuracy in spotting market turning points in advance.
You can use Fibonacci numbers as a predictive tool and when used correctly they can enhance a your analysis of the market, helping you to increase profits and decrease risk.
The History of Fibonacci Numbers
The Fibonacci number sequence first appeared as the solution to a problem in the Liber Abaci, a book written by Leonardo Fibonacci in 1202 to introduce the Hindu-Arabic numerals used today to a Europe still using Roman numerals.
The original problem in the Liber Abaci posed the question: How many pairs of rabbits can be generated from a single pair, if each month each mature pair brings forth a new pair, which, from the second month, becomes productive.
The Fibonacci number Sequence
The resulting Fibonacci numbers 1, 1, 2, 3, 5, 8, 13, 21, 34, 55, 89, are the result of the following equation.
If Fn is the nth Fibonacci number, then successive terms are formed by addition of the previous two terms, as Fn+1 = Fn + Fn-1, F1 = 1, F2 =
The ratio of any number to the next larger number is 62%, which is a popular Fibonacci retracement number. The inverse of 62% is 38%, and this 38% is likewise a Fibonacci retracement number.
Fibonacci Numbers and the Golden Ratio
Fibonacci numbers are found to have many relationships to the Golden Ratio F = (1 + /5)/2, a constant of nature which was of constant interest to the ancient Greeks, appearing in both Greek art and architecture.
Fibonacci Numbers and Market Analysis
Changes in stock prices are not simply a tug of war between supply and demand but also reflect human opinions, valuations, and expectations.
A study carried out by mathematical psychologist Vladimir Lefebvre demonstrated that humans exhibit positive and negative evaluations of the opinions they hold in a ratio that approaches phi, with 61.8% positive and 38.2% negative and that Fibonacci numbers are rooted in a trader’s psychology.
Predicting Market Movements with Fibonacci Numbers
Research shows markets as being perfectly patterned, explaining that humans, being part of nature, create perfect geometric relationships in their behaviours, even if they don’t realize it themselves.
The Golden Mean is the number 0.618. In Both Greek and Egyptian cultures, this number was highly significant. They believed that the number had important implications in many areas of science and art. This dimension was utilised in the construction of many buildings - including the pyramids.
The Golden Mean appears frequently enough in the timing of highs and lows and price resistance points that adding this tool to technical analysis of the markets can help to identify key turning points.
W. D.Gann and Fibonacci Numbers
Gann was a stock and commodity trader who reputedly made over $50 million trading the markets.
Gann made his fortune using methods which he developed for trading instruments based on relationships between price movement and time and his work was heavily influenced by Fibonacci numbers.
Gann divided price action into eighths and thirds. This yields numbers such as 1/3, 3/8, 1/2, 5/8, and 2/3. In percentage terms, these fractions are 33.3%, 37.5%, 50%, 62.5%, and 66.7%. These five ratios are commonly used retracement values. Gann placed strong significance on 50% retracements.
To learn more about using Gann trading methods please visit our web site: http://www.gann.co.uk
Article Source: http://EzineArticles.com/?expert=Stephen_Todd
http://EzineArticles.com/?Fibonacci-Numbers---How-to-Use-Them-for-Huge-Trading-Profits!&id=100193
FX5 Divergen

This is indicators that used divergence theory ...
red arrow = sell signal and green arrow = buy signal
Trading Idea

I would like to share some interesting trading idea that is not based on indicators. It is based on the interconnection between the Forex market and the Futures market with the following trading sessions:
According to many observations the forex market is adjusting to this market, the quotes differ only by some delta, except for JPY, CHF, and CAD. The futures market closes at 20:00 GMT on PIT and a certain SETT (Close) price is formed. It corresponds with the Close price of the 20:00 GMT price bar on the Forex market. This price is the future trading target. Near this price we can open some buy/sell limit orders with a range of 10-20pt. When the GLOBEX market opens (23:00 GMT) it will be tend to the SETT price. This principle is similar to the Gap Trading, when traders attempt to take advantage of the difference, or "gap," in price between the close of the previous day with the open of the following day.
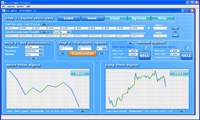
 Usually the target will be met within 4-5 hours. The failing percentage is around 10-15%. The best pair for this trading method is GBP/USD. This method does not work with crosses. The picture below show the statistics for GBP/USD for 2001-2005. The blue/green dots represent the successful buy/sell trades when the price met the trading target. The red dots represent the failed trades when the price did not return to the SETT price. As you can see the best range is between 10-20 pt.
Sourcer: http://metatrader5.blogspot.com
MetaTrader 5 Trading System
- Order. This is the direction to a brokerage company to buy or sell a financial security. There are two major types of orders: market and pending. Two more special orders are available in the new terminal - Take Profit and Stop Loss.
- Trade. It`s the fact of security buying or selling. A Buy is performed at the Ask price, while Sell is done at the Bid price. A trade can be opened as the result of market order execution or pending order activation.
- Position. It`s a market obligation, number of bought or sold security contracts. A long position is a symbol bought expecting the security price raise. A short position is the obligation to supply it expecting the further price fall. Only one position for a certain security can exist on a trade account.
How Does It Work?
An order to execute a trade with indicated parameters is sent to a broker from the client terminal. The order correctness is checked on the server. Are all the parameters (balance, lot, price, etc.) indicated correctly? If any of parameters does not meet the requirements, the order is rejected. If everything is correct, a trade order is placed to the Order Queue, after which it is sent to a dealer or to the market. An order can be also rejected in the market (stock exchange) or by the dealer.

An order turns into a trade if all its parameters are correct and it has been executed in the market. Depending on the current position for the security, the trade can result in the position increase, decrease or closing.
Example: we've got one position for EURUSD 1 Lot. If another lot is bought, the position will be increased to 2 lots. If 1 lot is sold, the position will be closed. If 0.7 lots are sold, the position will diminish to 0.3 lots.
Fill Policy
Besides common order execution rules set by a broker, trade operation execution policies can be set in MetaTrader 5. These policies allow making trading activities more flexible and setting strict parameters to manage the execution of trade operations.
source: http://www.metatrader4.com
