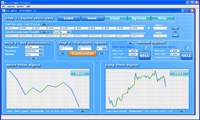


EA Forex Scanner

Based on the timeframe you're viewing, the scanner will check all currency pairs that your current MT supports. It will look for some of the most common technical analysis patterns and output them to the screen for your examination.
Please note: This is not an auto-trader. It will merely scan all charts and present you with the results and you can decide whether to enter a trade or not.
INSTALL THE SCANNER:
Here's the steps to installing this scanner
1 - Open the zip file to a new folder
2 - Place the WAV files (3 of them) in the folder \\sounds
3 - Place the file Homma.mq4 in the folder \\experts\\libraries
4 - Place the file GoHan_Scanner_Complete_M5.ex4 in the folder \\experts
5 - Open MT and attach the GoHan Scanner to a M5 chart
That's it. Now all you do is wait for a new bar and the latest alerts will be shown to you in the upper-left hand corner of the screen.
Remember, this is not an auto-trader. It will merely point you to the info and then you can evaluate the trade on your own.
WHAT THE SCANNER SHOWS
I have designed the scanner to look for a variety of common chart patterns across all currency pairs. The major patterns it looks for include:
- Double Top Lower Close - a price has hit the same high level twice and the latest bar has closed down, indicating a potential resistance point.
- Double Bottom Higher Close - a price has this the same low level twice and the latest bar has closed up, indicating a potential support point
- SMA 200 Breakout - The price has crossed either above or below the 200 SMA
- 3WMA and 5WMA Crossover - There has been a crossover (it will alert on either up or down) between the 3WMA and the 5WMA
- Bearish Engulfing - The latest candle has closed down and "engulfs" the previous gain, indicating a potential bear run
- Bullish Engulfing - The latest candle has closed up and "engulfs" the previous loss, indicating a potential bull run
- Three White Soldiers - a consistent rise over the last three periods
Download
Source: http://www.fictraders.com
Riding the forex rollercoaster
The past few weeks have been some of the most challenging I have seen in my 25 years working on Wall Street. Not surprisingly, the bad news and volatility that’s been occurring in the credit and financial markets has also spilt into the foreign exchange (forex) markets as well – and we’re seeing significant volatility across currency pairs, particularly where the US Dollar is involved.
Here’s proof. Looking at the daily price movement in EUR/USD from 5 PM NY to 5 PM NY time, we have, over a number of years, calculated the average daily price moment of the currency pair in a day Until this month the highest price movement differential was 1.55 per cent reached in September 2000. On average, the daily movement in price of the EUR/USD tends to average 1 per cent a day. but in the last few years we have had less volatility with narrower daily movements; in 2005 it was as low as 0.87 per cent, in 2006 – 0.73 per cent; 2007 – 0.60 per cent and year to date for 2008 - 0.98 per cent. However, looking at the month of September the average has significantly increased to 1.67 per cent (as at end of September 08), and up even more to 1.88% as of Oct 13, a marked difference from its average, and a reflection of the high volatility in the forex market currently.
But of course, with greater volatility comes better trading opportunities. Not only does volatility create wider spreads, but also more spikes in the market; enabling investors to make a decision on the future direction of a currency pair. But it also means higher risk, which makes it more important than ever to be well prepared before you start trading. For example, when you enter a trade you should have pre-set expectations for where you think the market will go (profit levels) and where you will get out if you are wrong (stop loss).
The extreme conditions in the credit markets are creating an inverted yield cure (where short term rates are higher than long term rates) in the US for the first time since the 1970s and from a forex perspective, this means you will see massive swings in the day-to-day roll rates on your Forex trades. The ‘Daily roll’ rate is the interest rate you earn or pay each day when you hold a currency overnight.
In short, volatility brings market movements, which brings the opportunity not only for returns, but for losses as well. So it’s vitally important you plan your trades carefully and understand the impact the activity in the wider market is having on the forex market. Forewarned is fore-armed after all.
Simple Logic Always Beats Complex Illusion

Metatrader Technical
Occam's Razor is an old scientific principle that suggests the simplest answer is typically the right answer to a given question. Often, the obvious can stare you right in the face and you will never realize it, the illusive obvious. The problem is not that illusion is distorting reality and creating confusion. The problem is that for most, the illusion is reality. As humans, we often look deeper into issues when attempting to resolve them which often ends up making the issue more complicated. Ever notice when you get into an argument with a loved one, the most heated part of the battle is typically filled with details? Then, by the next day, you realize that those details have nothing to do with the problem and the real yet simple issue becomes so clear? How many times have you said to yourself: "That was so simple, why didn't I think of that?" The illusive obvious is all around us if you think about it. I focus on the simplicity of markets and trading when writing articles and leading class rooms and Extended Learning Track (XLT) sessions for our Online Trading Academy graduates, but let me tell you something. Due to how complex most perceive this business to be, my job is not that easy. I spend more time peeling away the layers of illusion than I do delivering objective rules most of the time.
The Lemonade Stand
Recently, one of our XLT members (Shawn) sent in an email with a trade he took. He is one of our consistently profitable market speculators and understands the complex illusion traps that eat up trading and retirement accounts. Instead of falling for these traps, Shawn gets paid from them. One analogy I recently used in the XLT to describe how to properly think the trading markets is the simple Lemonade stand. Did you ever have a Lemonade stand when you were a child? Selling a cup of lemonade that costs you maybe $0.05 to produce for $0.50? Maybe even selling that same cup for $1.00? I am sure you didn't realize it then but you were taking some great trades, some real solid buying and selling. Remember how simple it was… You spent maybe $2.00 on the lemons, added some basically free water and ended up with $15.00 or $20.00 depending on the traffic at your street corner location.
Fast forward… Today, instead of being 8 years old, you're 40 and you're having a hard time with your trading, watching your 401 K turn into a 201 K, or worse yet, your retirement account is falling like a rock from the top of the Empire State Building and you don't know what to do. The way to fix this is not to seek the advice of so-called professionals who get paid not on performance but rather from giving you advice. Aren't these the same individuals that got you into this mess in the first place? Instead, bring yourself back to the days of the Lemonade stand. Remember the simple logic behind how you reaped huge profit margins and treat all these trading markets that appear to be so complex with that level of simplicity. I will use Shawn's real trade as an example of using simple logic to derive consistent income and build wealth.
Part of Shawn's Email:
Hello Sam,
Today I made two short entry trades and would appreciate your input on these trades. I believe they were both good trades but I would like a second opinion.
The first is on AA, it came right into a supply level on the daily chart where I shorted it. My entry price was 12.08. My first target is at 10.85 which is 3:1 and my second is 10.03 which is 5:1.
Thanks You,
Shawn W.
Shawn's Trade
Learning Center
WELCOME
UNIT A
ABSOLUTE ESSENTIALS
UNIT B
ANALYTICAL TOOLS
UNIT C
SYSTEM MODELING
UNIT D
SUM UP AND GO
*
Education
* Forex Basics
* Technical Analysis
* Fundamental Analysis
* Trading Strategies
* Market Psychology
* Related Markets
* Markets Daily Channel NEW!
* Books
* DVDs
* Conventions
* Workshops
* Home ::
* Education ::
* Trading Strategies ::
* Lessons from the Pros
* SendSend
* PrintPrint
* Add ToAdd To
Lessons from the Pros
5608460e-7dff-4b78-82da-ac426de62a45
8
1
Simple Logic Always Beats Complex Illusion
Tue, Jul 14 2009, 10:19 GMT
by Sam Seiden
Online Trading Academy
Lessons from the Pros
Subscribe to the Weekly Newsletter published by Online Trading Academy. Receive the full newsletter with charts!
Occam's Razor is an old scientific principle that suggests the simplest answer is typically the right answer to a given question. Often, the obvious can stare you right in the face and you will never realize it, the illusive obvious. The problem is not that illusion is distorting reality and creating confusion. The problem is that for most, the illusion is reality. As humans, we often look deeper into issues when attempting to resolve them which often ends up making the issue more complicated. Ever notice when you get into an argument with a loved one, the most heated part of the battle is typically filled with details? Then, by the next day, you realize that those details have nothing to do with the problem and the real yet simple issue becomes so clear? How many times have you said to yourself: "That was so simple, why didn't I think of that?" The illusive obvious is all around us if you think about it. I focus on the simplicity of markets and trading when writing articles and leading class rooms and Extended Learning Track (XLT) sessions for our Online Trading Academy graduates, but let me tell you something. Due to how complex most perceive this business to be, my job is not that easy. I spend more time peeling away the layers of illusion than I do delivering objective rules most of the time.
The Lemonade Stand
Recently, one of our XLT members (Shawn) sent in an email with a trade he took. He is one of our consistently profitable market speculators and understands the complex illusion traps that eat up trading and retirement accounts. Instead of falling for these traps, Shawn gets paid from them. One analogy I recently used in the XLT to describe how to properly think the trading markets is the simple Lemonade stand. Did you ever have a Lemonade stand when you were a child? Selling a cup of lemonade that costs you maybe $0.05 to produce for $0.50? Maybe even selling that same cup for $1.00? I am sure you didn't realize it then but you were taking some great trades, some real solid buying and selling. Remember how simple it was… You spent maybe $2.00 on the lemons, added some basically free water and ended up with $15.00 or $20.00 depending on the traffic at your street corner location.
Fast forward… Today, instead of being 8 years old, you're 40 and you're having a hard time with your trading, watching your 401 K turn into a 201 K, or worse yet, your retirement account is falling like a rock from the top of the Empire State Building and you don't know what to do. The way to fix this is not to seek the advice of so-called professionals who get paid not on performance but rather from giving you advice. Aren't these the same individuals that got you into this mess in the first place? Instead, bring yourself back to the days of the Lemonade stand. Remember the simple logic behind how you reaped huge profit margins and treat all these trading markets that appear to be so complex with that level of simplicity. I will use Shawn's real trade as an example of using simple logic to derive consistent income and build wealth.
Part of Shawn's Email:
Hello Sam,
Today I made two short entry trades and would appreciate your input on these trades. I believe they were both good trades but I would like a second opinion.
The first is on AA, it came right into a supply level on the daily chart where I shorted it. My entry price was 12.08. My first target is at 10.85 which is 3:1 and my second is 10.03 which is 5:1.
Thanks You,
Shawn W.
Shawn's Trade
Lessons From The Pros
The supply level above is supply because of the pattern, Rally – Base – Decline (a pivot high). The fact that price can't stay at that $12.00 area marked supply in the upper left means that supply exceeds demand. When this is the case, price declines. Over to the right, Shawn understands that someone who buys after a period of buying and right at a price level where supply exceeds demand is making the same two mistakes every consistent losing market speculator makes. This group of novice buyers who bought from Shawn when he sold short are caught in that world of complex illusion. The last thing they are thinking about is the Lemonade stand. This faulty thinking is rampant in the financial world and the people who get paid from this illusion-based thinking are those who realize that the action you take when speculating in markets is EXACTLY the same as the action you take in other parts of your life when buying and selling.
Focus on Those Who Bought From Shawn
1. They bought AFTER a rally in price. This is a big mistake. This is like walking into a car dealership, seeing a $30,000 car they like and offering the dealer $40,000. I am sure these buyers who bought from Shawn would never take that crazy action when buying a car. They likely would offer the dealer $25,000 but because they are in the trading markets, they throw all simple logic out the window. The lesson here is to treat these markets the SAME as when you go buy a car.
2. They bought at a price level where the chart told us supply exceeds demand. Let me ask you… When driving a car and you see that 500 feet in front of you is a huge concrete wall that is very thick. Question: Do you step on the gas pedal or the brakes? Simple answer of course. I don't even think you need driving lessons for that one. Why then would you buy a stock or into any market at price levels where supply exceeds demand? It does not make logical sense to take this action which is why the simple logical mind typically gets paid from the complex illusion-based mind.
What is also ironic is today's lemonade vs. the lemonade from years ago. For those over 30 years old, we know lemonade as lemons and water. Today's lemonade is a packet of 30 chemicals that may very well cause your insides to glow some blue/green color mixed with plastic bottled water that comes from who knows where. There are some real benefits in keeping things simple and real.
source : http://www.fxstreet.com
THV - V3

THV-V3 Indicator Metatrader
Step By Step :
- Download/unzip/Copy/Save the MQ4/EX4 file into your C:\Program Files\(your broker)MetaTrader 4\experts\indicators folder
- copy and paste the template file .tlp in C:\Program Files\(your broker)MetaTrader 4\templates folder.
- Close your MetaTrader application (assuming it’s currently open … Ignore this if the application hasn’t been launched)
- Launch your MetaTrader application
- Open a new chart and right click on it, select the THV template, ready

The main V3 rules:
Entry: Above Coral only long, below Coral only short
Price crosses cloud - both Trix cross each other and have the same color.
Best and most secure trend confirmation is a cross of the fast Trix on the zero level.
Exit:Faster Trix changes color and/or touch of a known good resistance/support level.
Other reasons to take profit can be: Touch of a trend line, resistance or support line, horizontal psych level (00 - 20 - 50 - -80) or a black cat that cross your screen
Stop Loss: please set your stop loss according to your money management plan, as higher your TF that you trade as lower you set the pip value and as higher the Stop Loss, also it depends on the currency pair that you are trading.
Download here
1. V3.zip
2. Manual THV V3.pdf
3. MTF indicators w manual.zip
4. Optional.zip
5. THV-V3
